
Geo3, the user interface
Configure, manage, visualize and download your data
Each project has a specific server, which is accessed through the user interface. This dashboard, accessible for free in SaaS mode, enables user to :
-
configure the complete setup of any project (calculation frequency, definition of measured points, radio communication, etc.)
-
manage running projects (notifications, automatic downloads, insert additional measuring point, etc.)
-
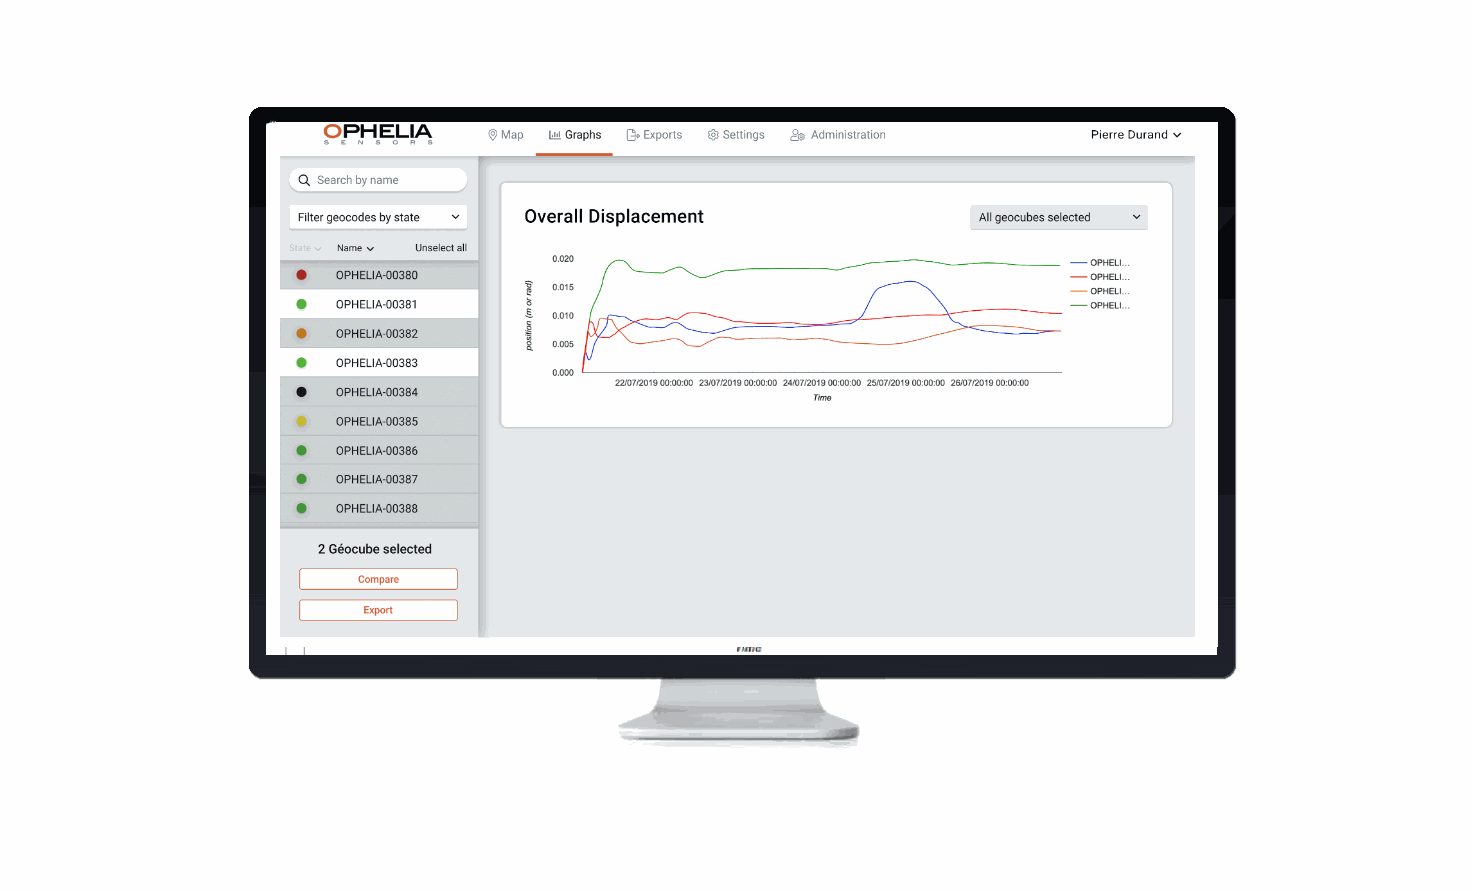
visualize graphs
-
define downloading options (projection type, data type, averages, FTP server, etc.)
Network management
-
Manage all of your projects on a single interface
-
Dialog with each Geocube to monitor its operating features

Mobility
-
Field access to install, parameter and monitor any Geocube system
No subscription
-
User interface is entirely free and accessible with every Geocube system
Multiple users
-
No limitation in the number of users for any given system
Access to data
-
Historical data downloadable with different parameter options (projection type, frequency, format)
Configuration
-
User interface allows identified user to easily modify the system's operating conditions (calculation frequency, network architecture, etc.)
System monitoring
-
In addition to notifications, user interface allows to monitor the global condition of the system (quality of radio connections, coherence of calculations, etc.)
Data display
-
Display of various graphs (raw data, average, sidereal correction) for each Geocube as per selected projection (ENU, ECEF, Lambert, geographic)
Assistance
-
Assistance to set-up the Geocube system and monitor its operating condition